
Oilsprings
Flat OT network. No segmentation. Full exposure — with the monitoring stack of your choice.
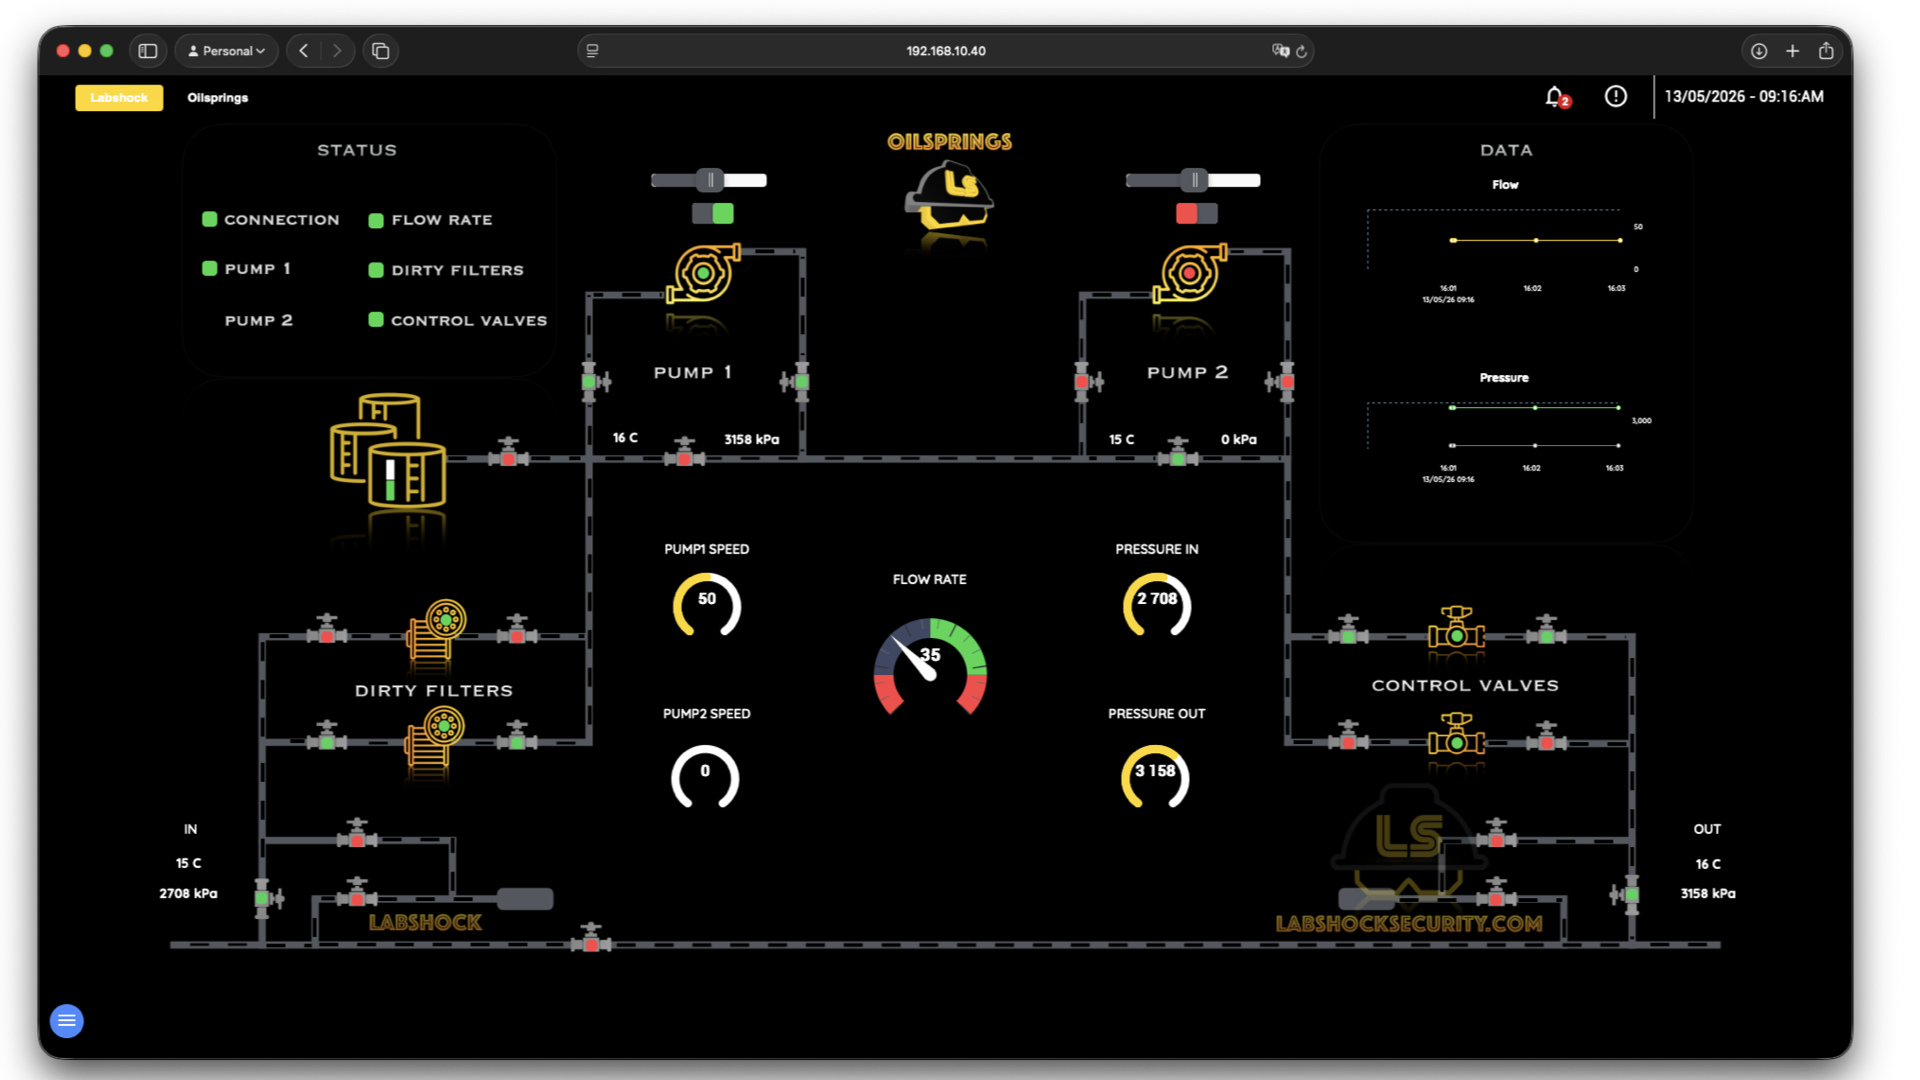
Oilsprings Air is a pure OT-focused industrial lab that simulates a flat, air-gapped control network.
Oilsprings Air represents a simplified industrial control system with no DMZ or external IT integration, closely resembling legacy or poorly segmented OT environments. The lab contains a modified OpenPLC, SCADA, Engineering Workstation, Pentest Fury, Network Swiftness IDS and Tidal Collector, all connected through a basic router.
Users can program PLC logic, observe SCADA interactions, capture and analyze OT traffic, practice protocol-aware security testing and see how logs and network events are generated in real time.
Oilsprings Air is designed to teach core ICS concepts such as protocol behavior, asset visibility, baseline traffic patterns and why lack of segmentation increases risk.
Before the pipelines came, there was silence. The Oilsprings field was discovered in a dry basin far from any city grid — a place where radio signals faded and supply trucks arrived twice a week. The engineers who built this station had one directive: keep it running. No cloud. No IT integration. No redundancy layers.
They wired the PLC directly to the pump actuators and ran a single cable to the SCADA panel in the control shed. The network was flat by design — flat by necessity. Every device on the same segment, every packet visible to every node.
Decades later, this architecture is still running. Nobody has changed it because nobody has needed to. The pumps work. The pressure holds. The logs go nowhere because nobody reads them.
This is Oilsprings Air. Not a training scenario. A photograph of what OT looks like when security was never part of the plan.
Monitoring variants
One plant. 4 ways to watch it.
The industrial process is identical in every variant — same PLC logic, same protocols, same topology. What changes is the detection and observability stack sitting on top of it, so you can compare what each one actually sees.
Oilsprings Air
FreeNo monitoring stack. The control network on its own.
Oilsprings Air is a pure OT-focused industrial lab that simulates a flat, air-gapped control network.
Oilsprings Air represents a simplified industrial control system with no DMZ or external IT integration, closely resembling legacy or poorly segmented OT environments. The lab contains a modified OpenPLC, SCADA, Engineering Workstation, Pentest Fury, Network Swiftness IDS and Tidal Collector, all connected through a basic router.
Users can program PLC logic, observe SCADA interactions, capture and analyze OT traffic, practice protocol-aware security testing and see how logs and network events are generated in real time.
Oilsprings Air is designed to teach core ICS concepts such as protocol behavior, asset visibility, baseline traffic patterns and why lack of segmentation increases risk.
Before the pipelines came, there was silence. The Oilsprings field was discovered in a dry basin far from any city grid — a place where radio signals faded and supply trucks arrived twice a week. The engineers who built this station had one directive: keep it running. No cloud. No IT integration. No redundancy layers.
They wired the PLC directly to the pump actuators and ran a single cable to the SCADA panel in the control shed. The network was flat by design — flat by necessity. Every device on the same segment, every packet visible to every node.
Decades later, this architecture is still running. Nobody has changed it because nobody has needed to. The pumps work. The pressure holds. The logs go nowhere because nobody reads them.
This is Oilsprings Air. Not a training scenario. A photograph of what OT looks like when security was never part of the plan.
Oilsprings Splunk
FreeOT telemetry piped directly into Splunk.
Oilsprings Splunk extends the base Oilsprings environment with a full Splunk integration layer — routing real OT telemetry from PLC and SCADA systems into a production-grade SIEM pipeline.
The lab adds a Splunk instance pre-configured to receive industrial event data from Tidal Collector. Every PLC state change, SCADA operator action, and IDS detection fires into Splunk in real time. Pre-built dashboards surface OT-specific views: process state, network anomalies, and control system events.
Users can validate detection rules, build correlation searches against real industrial data, and test SOC workflows using events generated by actual Modbus traffic and PLC logic execution.
The Oilsprings basin was running blind for years. The SCADA panel showed green. The pumps ran. Nobody looked deeper because there was nothing to look with.
Then the auditors came. They asked one question: where do your logs go? The answer was nowhere. They left a requirement behind: you need visibility.
The engineers ran a collector cable from the control shed to a server room three buildings over. They installed Splunk on hardware that had been sitting in a shipping crate since the previous budget cycle. They piped everything in — PLC events, network captures, SCADA sessions.
The first dashboard came online at 03:14 on a Tuesday. By 03:17 it had already surfaced three anomalies that nobody knew existed. Oilsprings Splunk is what happens when a field that never had eyes finally gets them.
Oilsprings ELK
FreeOpen-source observability with Elasticsearch and Kibana.
Oilsprings ELK pairs the Oilsprings control environment with an open-source observability stack built on Elasticsearch, Logstash, and Kibana.
Industrial telemetry from the PLC, SCADA, and IDS flows through Tidal Collector into Logstash pipelines, normalized and indexed into Elasticsearch. Kibana dashboards provide OT-specific visualization: protocol traffic volumes, PLC register changes, detection rule hits, and operator session timelines.
The lab is designed for teams running open-source security stacks who need to validate industrial detection logic, build custom OT dashboards, or test log parsing pipelines against real ICS data.
Not every field operation runs on enterprise licensing. The Oilsprings ELK installation was built by a single engineer over three weekends using hardware salvaged from a decommissioned monitoring station and open-source software downloaded on a satellite connection.
The Logstash pipelines were hand-written. The Kibana dashboards were built panel by panel. The Elasticsearch cluster runs on two nodes and a prayer. But it works — and it sees everything the Splunk deployment sees, for a fraction of the cost.
This is the other path. Not the vendor-approved architecture. The one built by someone who needed visibility and had no budget to buy it.
Oilsprings Wazuh
FreeFree OT SIEM lab. Manager and dashboard, already connected.
Oilsprings Wazuh pairs the Oilsprings control environment with a deployed Wazuh manager and dashboard, and it is free — no license, trial or card.
Industrial events reach Wazuh through Tidal Collector: PLC state changes, SCADA operator actions and process signals, normalised into the ingestion pipeline and indexed alongside host telemetry.
The workflow the lab is built for is a loop. Trigger an action on the OT side, find the matching event in the dashboard, write a rule for it, confirm the rule fires, then break something and read your own alert text. The last step is the one most detection work skips, and it is where you find out whether the alert tells an analyst what happened to the process.
A SIEM fed by static sample logs teaches the query language. A SIEM fed by a running industrial process teaches detection.
The difference only shows up at the moment an event you caused appears among traffic you did not cause. Until then, a rule is a hypothesis.
This lab is free because the license was never the obstacle. Access to a process you are allowed to test was.